
Chartbrew - Client reports for your team and clients
Chartbrew allows you to connect all your databases and APIs to create beautiful live charts and visualize your data in custom dashboards
Categories:
Chartbrew is an open-source reporting platform that connects databases and APIs to create beautiful, live dashboards and interactive reports for teams and clients.
🚀 Overview
Chartbrew solves the challenge of visualizing and sharing data from scattered sources like databases (SQL/NoSQL) and APIs by providing an intuitive platform to build custom dashboards, charts, and reports that update in real-time.
It's built for developers, teams, and agencies who need collaborative tools for client reporting, KPI tracking, and data insights without complex setups. Whether self-hosting the open-source version or using the hosted service, it empowers users to deliver actionable data visualizations quickly.
The project was created to democratize data visualization, making it accessible, embeddable, and AI-enhanced for modern teams relying on live data.
✨ Key Features
- Connect directly to databases (MySQL, PostgreSQL, MongoDB, Firestore) and APIs to fetch and visualize data with a drag-and-drop chart builder.
- AI Assistant for natural language queries, SQL/MongoDB optimization, chart generation, and data exploration.
- Embeddable interactive dashboards, scheduling, data alerts (email/Slack), and anomaly detection.
- Client accounts, report templates, team collaboration with role-based access, and multi-tenant security.
- Upcoming: More integrations and AI enhancements based on community feedback.
🛠 Tech Stack
- Frontend: React, Redux, Tailwind CSS
- Backend: Node.js
- Database: PostgreSQL, MySQL, Redis
- Auth: Custom (role-based access control)
- Hosting: Docker (self-hosted), chartbrew.com (hosted)
👥 Who Is This For?
This project is useful for:
- Developers who want to embed live analytics in apps or self-host custom dashboards
- Teams looking for collaborative reporting with AI insights and alerts
- Agencies building client portals with branded, scheduled reports
📸 Screenshots / Demo
- Live demo: https://app.chartbrew.com (14-day free trial)
- GitHub: https://github.com/chartbrew/chartbrew
🔥 Project Status
- 🟢 Actively building
Last updated: 2026-03-24
❓ FAQ
Is this project free?
Freemium / Paid — Open-source self-hosting is free. Hosted plans start at $24/month (Starter) with 14-day free trial, no credit card required. Enterprise custom.
Is the source code available?
Yes — https://github.com/chartbrew/chartbrew
Can I contribute?
Yes — Open issues, submit PRs on GitHub, join the Discord community for feedback and discussions, or sponsor via GitHub Sponsors.
📬 Contact & Links
- Website: https://chartbrew.com
- GitHub: https://github.com/chartbrew/chartbrew
- Twitter/X: https://x.com/chartbrew
- Discord: https://discord.gg/KwGEbFk
Built with ❤️ and kept warm on WarmIndex.
Similar apps

PopSQL - Collaborative SQL Editor - Bring Order to SQL Chaos
popsql.com
PopSQL is a unified SQL collaboration workspace that connects everyone in the data analysis process so you can obtain better insights by asking the right questions, together.
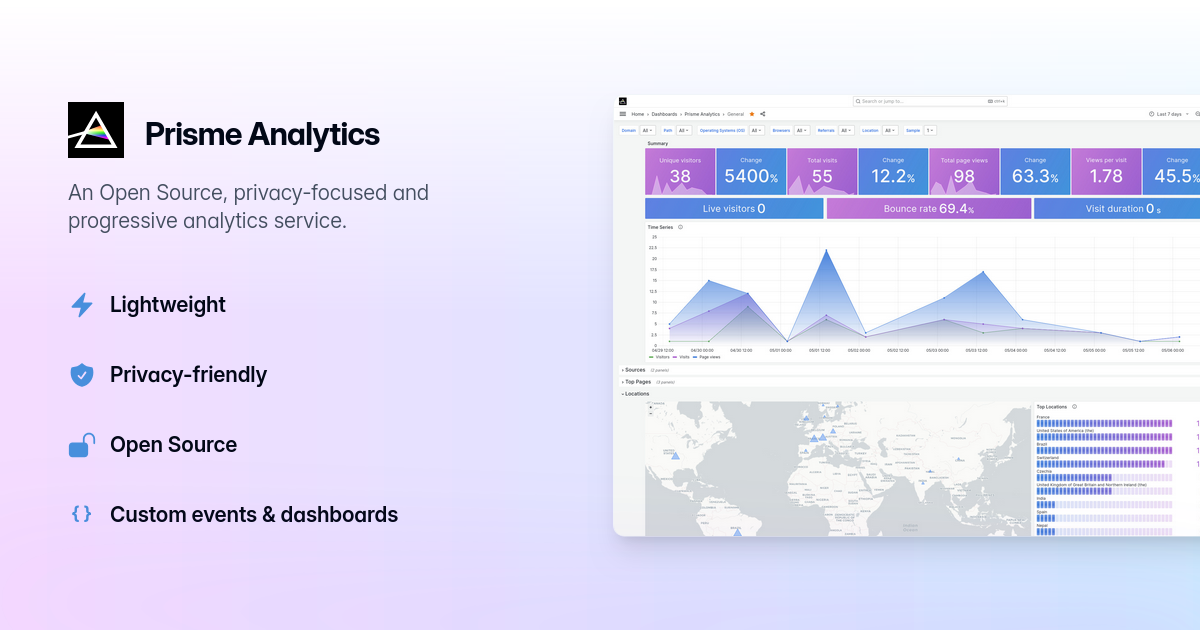

Prisme Analytics | Customizable, privacy-friendly Google Analytics alternative
prismeanalytics.com
Prisme is an Open-Source, privacy-friendly and progressive web analytics service. Your website data is 100% yours and the privacy of your visitors is resp…


Redash helps you make sense of your data
redash.io
Use Redash to connect to any data source (PostgreSQL, MySQL, Redshift, BigQuery, MongoDB and many others), query, visualize and share your data to make your company data driven.


Offen Fair Web Analytics
offen.dev
Let your users access their data. Gain valuable insights at the same time. Open, lightweight, self hosted and free.